
Timing the Stock Market (A 58-year look)
Timing the Stock Market (A 58-year look)

UP, DOWN, and SIDEWAYS stock markets
With the recent weakness in the stock market over the last few weeks, I thought it would be useful to traders and investors to update my stats that will included in a new book I’m writing, due out mid-year 2022. The study was originally done for a research paper on my website, enjoytheride.world. I took the S&P 500 Index data available on Yahoo Finance and created a simple 10 and 40 day moving average indicator to measure up or down direction shifts. I then labeled each signal up down or sideways.
My target for an up or down move was for the index to move at least 5%. If a signal yielded less than 5% before that move ended with a new signal in the opposite direction, I deemed it a sideways move. My goal was to get a sense of how much time the stock market spends in up, down, and sideways action. On the next page is a table of findings:
Summary of Timing versus Buy and Hold, January 1964 to December 2021 (58 years):
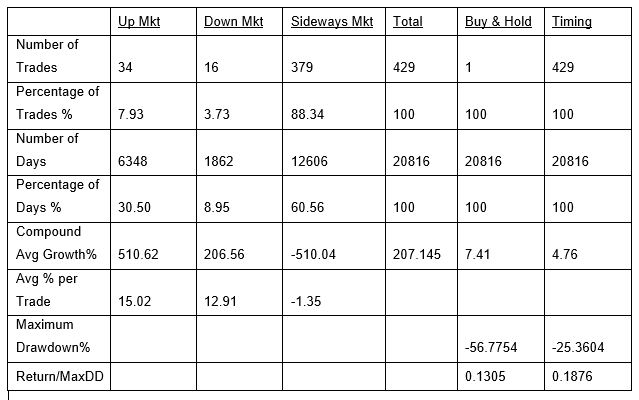
Numerous important points are discovered when you look at the results. First, the stock market spends a heck of a lot of time going nowhere. Over 60.5% of the days are spent in sideways market conditions. Only 30.50% of days give you the wind at your back in up markets. Down periods constitute only 9.95% of time.
Down markets are usually faster moving than up markets. Fear apparently motivates traders to act quickly. In Down markets you would have gained 12.91% compound growth rate for only 9.95% of the time. Up markets grind it out a bit more for 15.02% return during 30.50% of the time. Quick math tells us that Down markets achieve 12.91%/15.02% = 85.95% of the movement of Up markets in 8.95%/30.50% = 29.34% of the elapsed time. When Down markets do occur, they can move quickly.
The next thing you should take note of is the maximum drawdown percent. As we previously mentioned, most traders, including me would not have the stomach to tolerate a -56.78% drawdown in the Buy and Hold strategy. Therefore, the strategy would be likely abandoned at some point, and the trader would never see the total Compound Average Growth Rate indicated. Timing cut that drawdown in half, a lot easier drawdown to tolerate.
Last item that I realized was that the return for Timing is 64% of the return for Buy and Hold, while the Maximum Drawdown is less than half. Therefore, the return to maximum drawdown was 0.1305 for Buy and Hold versus 0.1876 for Timing, a 43.7% improvement in return to risk. This characteristic alone will tend make the ride a lot easier over the decades and allow you more psychological room to stick with the strategy.
Bottom line: The market will do what the market will do. It goes up, down and sideways and you need a way to deal with all types of markets. The indicators have the market in a DOWN mode as I write this. Hopefully everyone has thought through how they should trade in a
DOWN market and are prepared for what may come if conditions continue for a while. Execute your strategy flawlessly and enjoy the ride!
This research and the way you present it here make it easy to understand where TF strategy returns come from and where losing periods may be expected. Well written article to introduce someone to TF.
Great work. I have 2 suggestions to make. The first is about the 10/40 ma oscillator. Rather than using 10-40 ma use 10/40 so you can compare different markets. Check what the 5 percent is on the 10/40 and that is your benchmark for all markets. The second idea is to check how long it take to get to that 5 percent: if after x days we have not reached 5%, perhaps the probability of being in a congestion are higher so it would make sense cut exposure and/or go flat. Thank you again for all your work.